Farewell to our Data Analyst Lucas Koepke
This week TASCHA says goodbye to our Data Analyst Lucas Koepke. Lucas became TASCHA’s statistical backbone 7 years ago after earning his Master of Science in Statistics from the University of Washington. Before Lucas heads out the door, we gave him the opportunity to share some of his favorite work at TASCHA. Here’s Lucas in his own words:
My work at TASCHA started off at full speed when, fresh out of grad school, I was tasked with exploring cluster analysis on the Global Impact Study data. The goal was to see if there were hidden groups of users based on both frequency of use for various tasks on a computer or the internet, and the perceived impact reported for various areas. With that level of direction, I explored a variety of clustering algorithms and tested various data processing approaches to get the best results. As an example, the following graph shows one possible way the various tasks could be grouped together, based solely on how similar users responded in the survey.
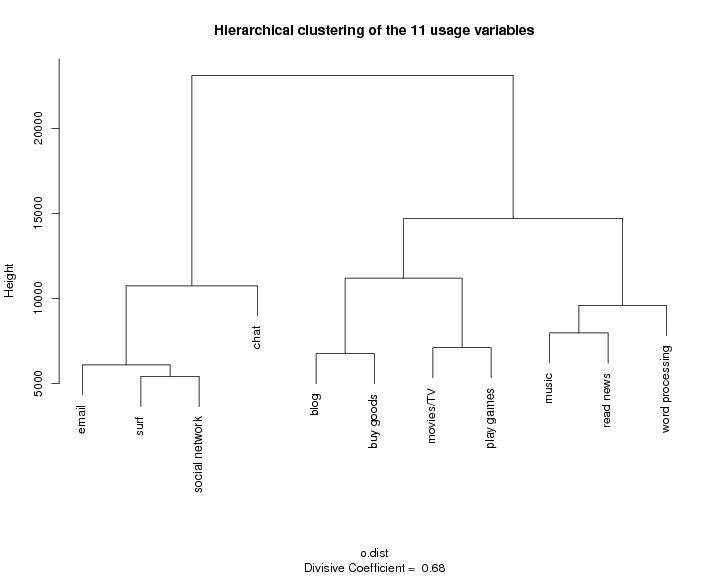
Clustering usage variables for the Global Impact Study
At the bottom of the graph, all the tasks are separate, but as you travel up the y axis the tasks join when they are similar “enough.” For example, the first two to join are the most similar (surfing the web and using social networks), while the last two groups to join are the most dissimilar.
My first opportunity to work with Big Data came from a collaboration with former iSchool Professor Josh Blumenstock, studying the use of a new mobile money system by a cell phone provider in Afghanistan. Although the data was not particularly large (only about 4 million rows) there were many challenges processing the data for analysis, and I learned a great deal working with Josh.
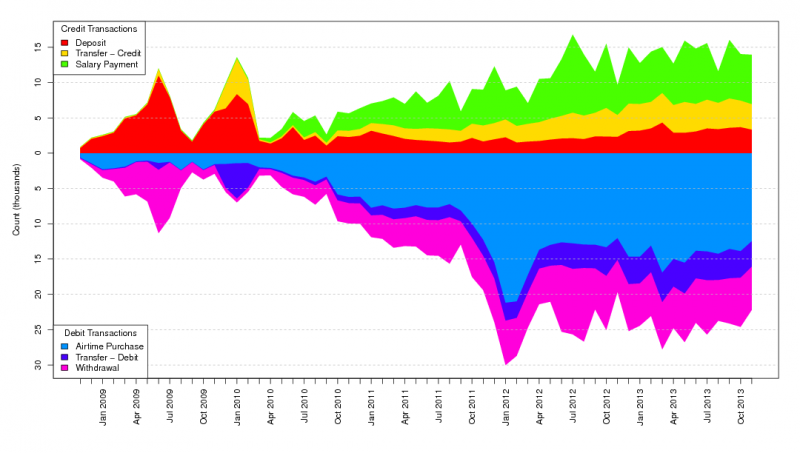
M-Paisa Usage Monthly Counts
From our ICTD 2015 paper:
Initially launched in 2008, Afghanistan’s primary mobile money network (M-Paisa) has seen slow but steady growth over the past several years. Salary payments, the focus of this study, represent a significant source of funds deposited into the M-Paisa system. The above figure shows the number of transactions effected per week, for the six most common transaction types.
Lastly, I’ve had the opportunity to work closely with TASCHA Principal Research Scientist Maria Garrido on a variety of projects, but one of the more challenging ones has been on the Development and Access to Information Project. Measuring the impact of access to information on the SDGs is an ongoing challenge, and over the course of the project we have had many interesting discussions. For example, a map showing the percent of the population using the internet shows plenty of variability, but determining which factors are at play (economic, freedoms, etc.) is difficult.
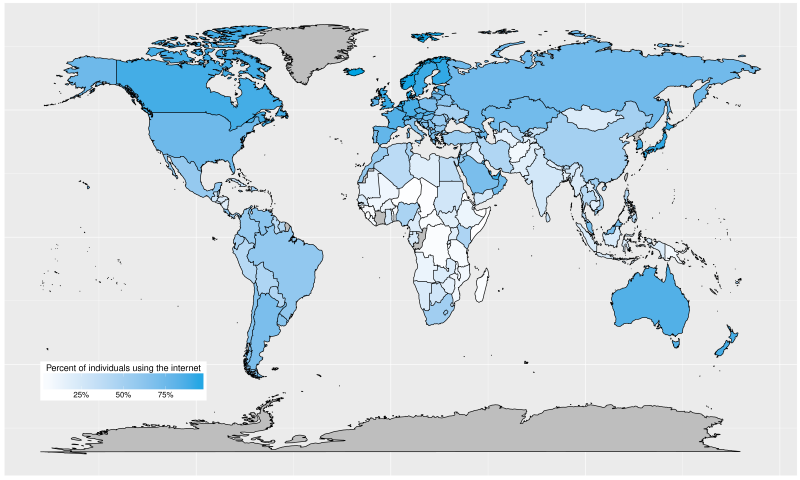
Map of 2015 Internet Use
We’ll do our best to continue exploring the data without you. Lucas will begin his new position with the National Institute of Standards and Technology (NIST) through a collaboration with University of Colorado Boulder next week. Thanks again, Lucas, and good luck!